


Hello there!
Have you ever wondered how you can create fancy cryptocurrency price charts without any coding experience? Fret not, by following this guide you can now create one on Google Sheets with the help of CoinGecko’s API!
Excited to get started? Let’s dive right in!
Step 1: Navigating around CoinGecko’s API documentation
-
- Head over to CoinGecko’s API documentation and scroll down till you see the coins/{id}/market_chart endpoint.
- Click on the dropdown and click Try It Out.
- Pass in the coin ID you are interested in tracking. You can also search for the coin ID using the /coins/list endpoint.
- Note: For the purpose of this exercise, we will be using Bitcoin, Ethereum and Avalanche as an example.
Step 2: Getting the data points
-
- Pass in Bitcoin, USD, and 365 days in the respective parameters. Appended is an example:

-
- Copy and paste the entire data into a CSV converter in the response body.

-
- Click Download CSV and import this into your Google Sheets.
- Prices_001 refers to Epoch timestamp while Prices_002 refers to the price. We would only require these 2 data points.
- Repeat the aforementioned steps for Ethereum and Avalanche.
Step 3: Rearranging our data in Google Sheet
- Copy and paste the long list of Prices_001 (Epoch timestamp) into Epoch Converter. Once you have the UNIX timestamp converted, you should receive a list of UTC timestamps.
- Copy all the data into a new sheet. Sample as below:

- Insert a new column to formulate a new formula (i.e. column D, F and G) to chart the data. A sample of formula on cell D4 is as follow: =(C3-$C$2)/$C$2
Step 4: Building our chart in Google Sheets
- Click on insert and then Chart
- Under Setup, choose “Line Chart” and input your data range as B1:B367,D1:D367,F1:F367,H1:H367
- Tick “Use Row 1 as headers” and “Use column B as labels”
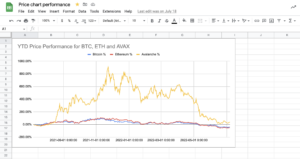
- You can also customize your chart title. For now, let’s just use “YTD Price Performance for BTC, ETH and AVAX” as the header.

Voila! You have now built your first historical crypto price chart on Google Sheets using the CoinGecko API! Feel free to chart your favourite cryptocurrencies and share them with us on Twitter by tagging us @coingecko. Would love to see what you have built with our API 
Appendix:
You can also find below some of the resources and links for your convenience.
- CoinGecko API documentation
- CoinGecko API plans
- CoinGecko API Token List on G.Sheets
- Sample template using this process
- CoinGecko.com
If you are interested in finding out more information on CoinGecko’s Enterprise API plans, feel free to fill out your information in the form below.
window.hsFormsOnReady = window.hsFormsOnReady || [];
window.hsFormsOnReady.push(()=>{
hbspt.forms.create({
portalId: 5275236,
formId: “a5f8b675-216e-4fc2-965b-ca9b4252aafc”,
target: “#hbspt-form-1689055481000-4458801257”,
region: “na1”,
})});
The post Charting Historical Crypto Prices on Google Sheets using CoinGecko API appeared first on CoinGecko Blog.